
Understanding the JVM Garbage Collector
I never thought I’d say something like this but… “I like Java”. I first met Java (I think it was Java 6) at the university during my OOP course. I was more worried about learning this new (for me) programming paradigm than learning Java’s API. Don’t get me wrong, I still think it was the right call but I ended up with a misimpression about the language.
I’ve been working with Java 8 as a full time developer for 18 months. Before starting this new job at MuleSoft, I was not really enthusiastic about working in Java, maybe because I was quite convinced that it was an extremely verbose old-fashioned language that made programming a painfully slow task because of all the overhead you had to type in order to get something done.
I couldn’t be more wrong.
The true thing is that your IDE (IntelliJ in my case) generates most of the annoying boilerplate code for you, and the language enhancements that Java 8 introduced (mostly because of the all-mighty lambdas) made me feel that programming in Java could feel like natural once you find yourself in the right mindset.
A word about IntelliJ: Get to know your tools! If you are going to code all day long in a certain environment, make sure to learn back and forth all the tips and tricks that will make your everyday job a smooth ride.
And talking about knowing your tools and working in Java, I just wanted to share a few resources I’ve ran into while trying to grasp how the JVM garbage collector works.
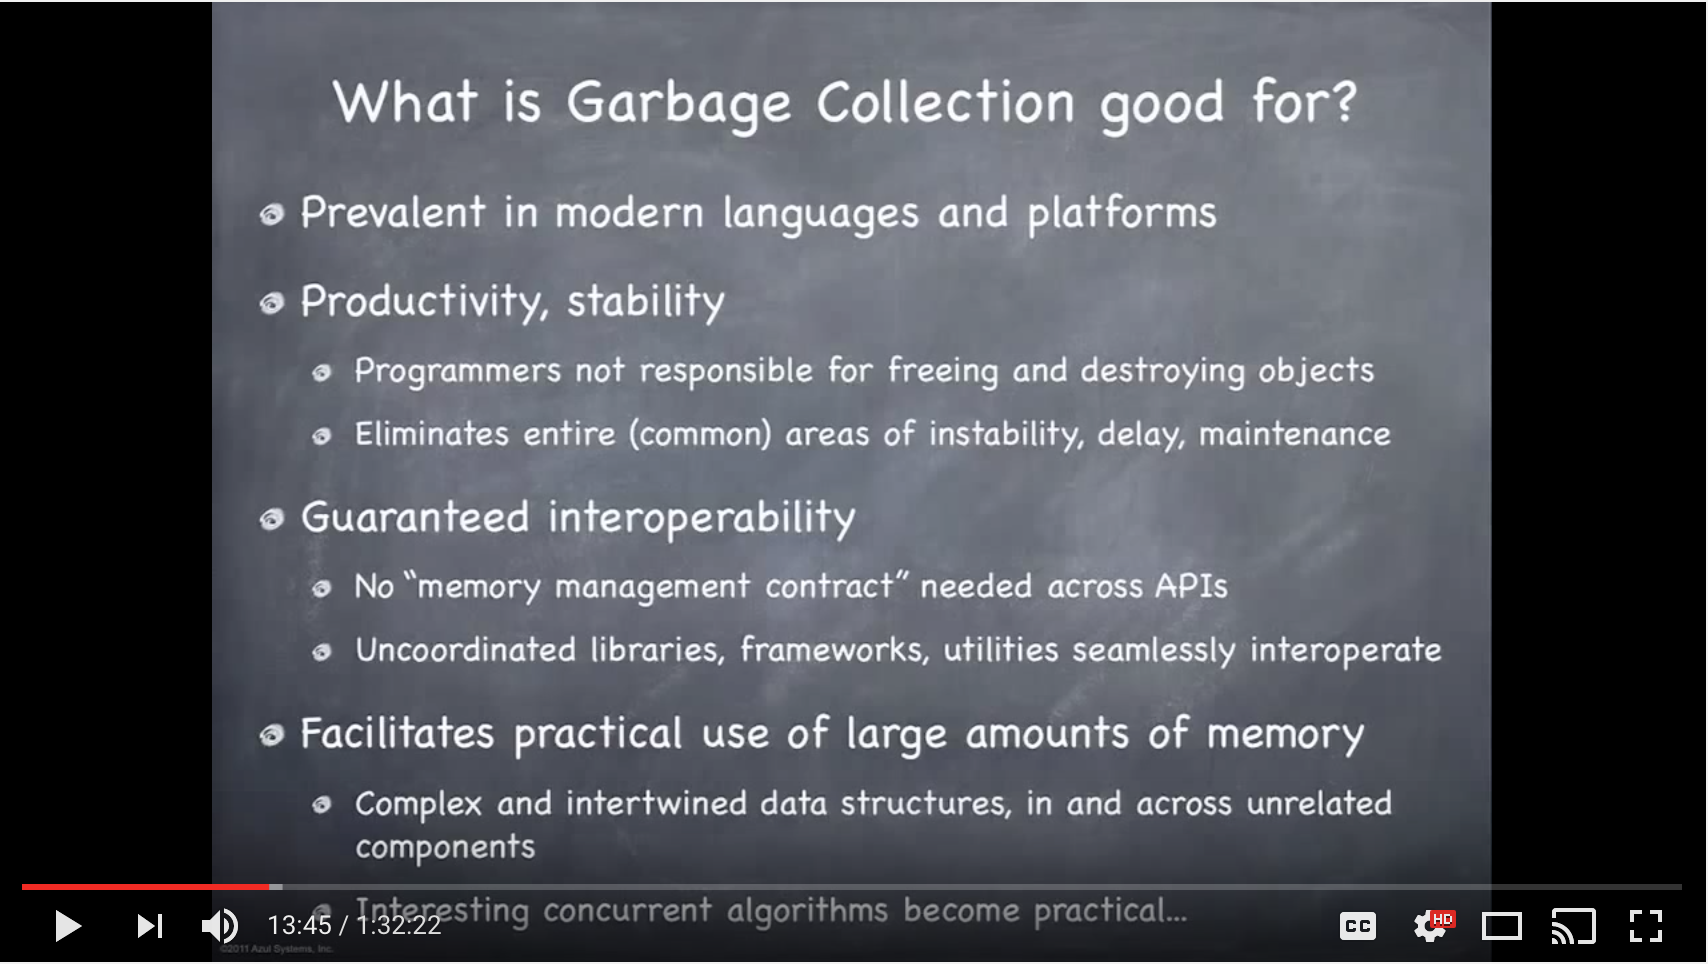
First of all, take a minute (or maybe 1 and a half hours) to check the following video in which you will go from zero to a decent amount of knowledge about the GC, its different algorithms and all the terminology involved in that universe.
Ok, now that you have an idea about the GC internals, I’ll leave you two links for you to go even deeper on the subject. Those links give you an overview of the video and show how to actually generate a program that will eventually throw an OOM exception and more importantly it will teach you how to profile that same program explaining what the profiler tries to tell you (this is not trivial at all!).
And finally, someone made a few animations picturing memory fragmentation in the heap and how each GC algorithm deals with that.
Hope you’ve learned something about GC because I sure did!
Comments